
Cover: conceptual AI-generated illustration. It does not depict an actual test or measurement.
No. Passing a simulator test demonstrates the assessed behaviour in that configuration; it does not, by itself, establish clinical SpO₂ accuracy in patients. Monitor, sensor, cable, algorithm and conditions of use all contribute to measurement. Understanding these boundaries produces better technical conclusions.
Consider this illustrative scenario: a pulse oximeter returns from service with a report showing several simulated points passed. The team asks: “Does that mean every patient reading will be correct?” The report is useful, but that conclusion exceeds its evidence. The challenge is to understand which question each form of evidence answers.
What does a simulator test, and what remains outside its scope?
A pulse oximeter estimates peripheral saturation, SpO₂, through optical signals and processing. A simulator provides controlled signals to investigate system responses according to its compatibility and procedure. A patient introduces biological and usage variables that a bench signal does not fully reproduce.
| Evidence | Question it helps answer | Conclusion that does not follow automatically |
|---|---|---|
| Functional simulator test | Does the system respond to the specified signals and parameters? | Clinical accuracy in every patient |
| Clinical accuracy evaluation | How does the system compare with a reference in studied participants? | Identical performance in every context |
| Inspection and service history | Is there damage, incompatibility or change after intervention? | Absence of every algorithm limitation |
| Clinical assessment during use | Is the reading consistent with context and other information? | That an isolated number is enough for a decision |
A well-documented functional test remains valuable. It can identify reproducible problems and compare conditions before and after service. The mistake is turning that scope into a guarantee it did not investigate.
What did 11,018 paired measurements reveal?
The EXAKT study (Martin and colleagues, BMJ, 2026) recruited 903 critically ill adults in 24 English ICUs from June 2022 to August 2024. It evaluated five fingertip models supplied for NHS home monitoring. The ICU monitors used for patient care were not the devices being evaluated.
Researchers collected 5,656 arterial saturation measurements, yielding 11,018 paired observations with up to two oximeters. Skin tone was measured objectively by spectrophotometry. Repeated observations were accounted for in the models; 11,018 observations do not mean 11,018 independent patients.
| Reported comparison | Result across the five models | How to read it |
|---|---|---|
| SpO₂ difference, median dark versus median light skin tone, at a given SaO₂ | +0.6 to +1.5 percentage points | A difference in readings, not a universal correction |
| Estimated false-negative rate: SpO₂ >94% despite SaO₂ ≤92%, median dark skin tone | 7.6–62.2% | Model-specific estimates; not prevalence among all patients |
| Same false-negative definition, median light skin tone | 1.2–26.9% | Same comparison framework |
| Within-model absolute difference, dark minus light | +5.3 to +35.3 percentage points | Do not subtract the opposite endpoints of the two ranges |
| Within-model ratio of false-negative rates, dark divided by light | 2.3–7.1 | Rate ratios, not a single pooled risk estimate |
These are ranges across models, not confidence intervals. The study models included saturation, skin tone and other factors. All five devices tended to overestimate lower saturations and underestimate higher ones. Poor perfusion in critically ill patients may also affect readings, and findings should not be generalized to every model or setting.
Why can one percentage point matter near a threshold?
Consider an illustrative arithmetic example, not a study result or treatment rule. Keep arterial saturation fixed at 92% and change only a hypothetical displayed value:
| Scenario | Arterial reference | Displayed SpO₂ | Above the study’s 94% threshold? |
|---|---|---|---|
| A | 92% | 93.5% | No |
| B | 92% | 94.5% | Yes |
The display changed by 1 percentage point, but its classification changed. This explains why an average error and a threshold-based outcome answer different questions. It does not estimate the probability of that event or justify correcting a patient’s reading by one point.
Bias, precision and A_RMS answer different questions
Bias describes systematic error; precision describes scatter; root mean square error combines error magnitude. An aggregate score does not tell us how errors fall around a decision threshold. EXAKT found that its overall A_RMS metric did not adequately reflect the diagnostic differences across skin tones.
Here is a synthetic two-reading calculation to make the distinction concrete. Errors are displayed saturation minus reference saturation, in percentage points. These numbers are invented for arithmetic; they are not devices, patients or acceptance limits.
| Illustrative error set | Mean error (bias) | RMS error |
|---|---|---|
| −2 and +2 percentage points | (−2 + 2) / 2 = 0 | √[(4 + 4) / 2] = 2 |
| 0 and +2.828427… percentage points | Approximately +1.414 | √[(0 + 8) / 2] = 2 |
The same RMS error can coexist with different bias. Conversely, a zero mean error does not mean every reading is correct. For a technical reader, the practical question is which metric and reference support the claim being made.
Translating a rate into a workload without changing the denominator
A false-negative rate concerns observations that meet the reference definition of the condition. In EXAKT’s comparison above, the relevant condition is SaO₂ ≤92%; the missed classification is SpO₂ >94%.
For an invented example, a 10% false-negative rate means 10 missed classifications per 100 reference-positive observations. A 30% rate means 30 per 100. The absolute difference is 20 percentage points, the ratio is 3, and the relative increase is 200%. None is the same as saying 30% of all patients were missed.
This conversion is useful when explaining a report to a purchasing or clinical team. Keep the eligibility condition, unit and period beside the number. Do not count repeated measurements as new people, average unmatched device ranges or turn this example into an estimate for your hospital.
What does an earlier study add?
In Sjoding and colleagues, 2020, the Michigan subgroup with SpO₂ of 92–96% had arterial saturation below 88% in 88/749 measurement pairs (11.7%) from Black patients and 99/2,778 (3.6%) from White patients. Participants were hospitalized adults; paired measurements were taken within ten minutes.
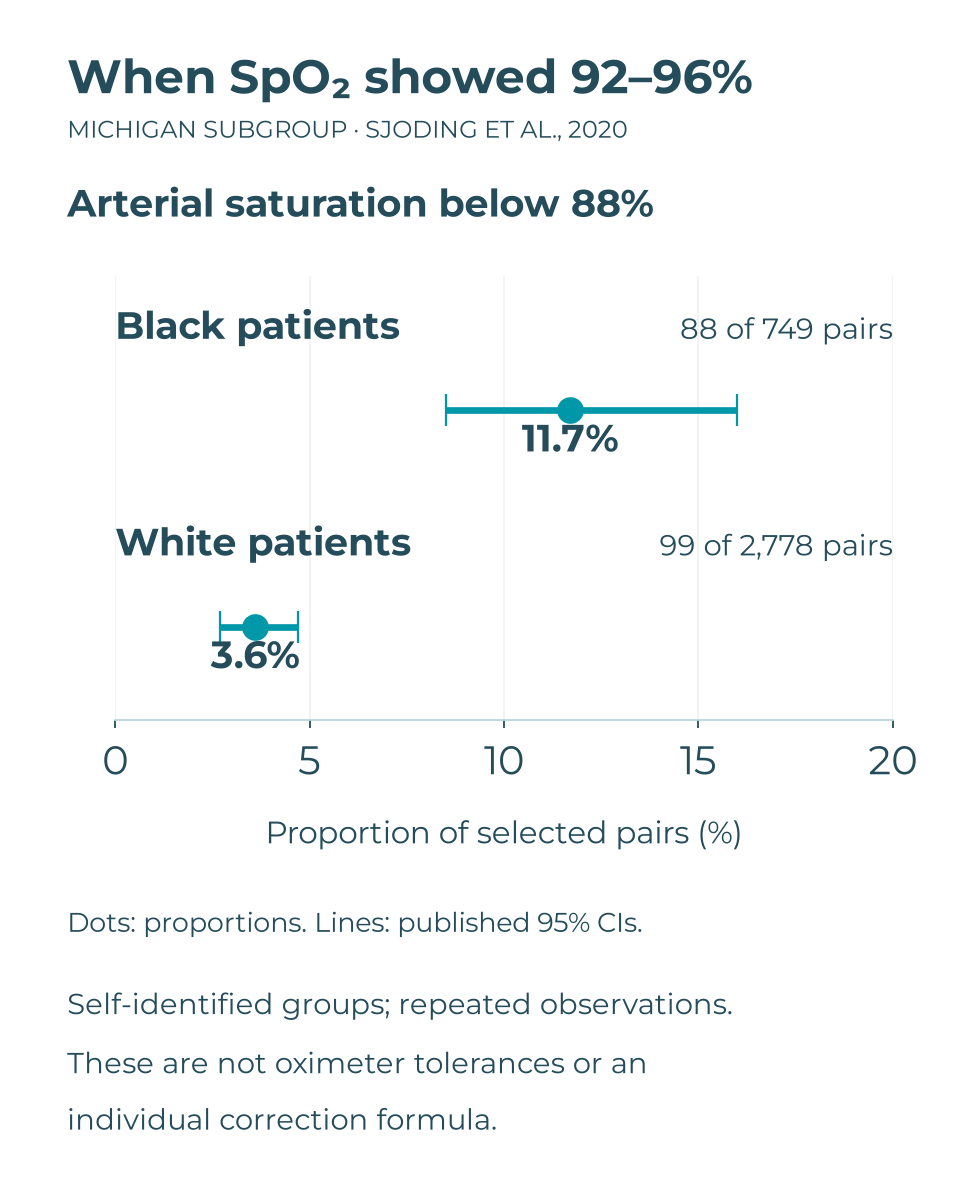
How to read the lines: they show the published 95% confidence intervals for these proportions. They are not an SpO₂ reading error range or an oximeter acceptance criterion. The table preserves the numerical values for reference.
| Self-identified group in the study | Pairs with arterial saturation below 88% | Proportion’s 95% CI |
|---|---|---|
| Black patients | 88/749 — 11.7% | 8.5–16.0% |
| White patients | 99/2,778 — 3.6% | 2.7–4.7% |
Using the published rounded proportions, 11.7 − 3.6 = 8.1 percentage points, while 11.7 / 3.6 ≈ 3.25. These are descriptive calculations, not adjusted estimates or new confidence intervals. The groups and definitions differ from EXAKT, so the two studies should not be pooled.
The denominator is selected measurement pairs, not all patients or all pulse oximeters. The research was retrospective, included repeated observations and used self-identified race without directly measuring skin pigmentation. It did not test simulators or Yagi and supplies no individual correction formula.
The useful lesson is the difference between confirming a bench response and establishing clinical agreement. A monitor can respond appropriately to a simulated signal without that test explaining every difference observed in humans. The technical consequence is preserving the conclusion’s scope, rather than broadly certifying “accuracy in patients”.
How do regulatory references separate these evaluations?
The FDA’s final 2013 guidance for 510(k) submissions treats the system as monitor, sensor and cable. It describes functional testing in particular circumstances and accuracy assessment against an arterial co-oximetry reference; system changes require appropriate justification.
This supports the distinction between evidence types. The guidance addresses US premarket evaluation, not a universal maintenance procedure. Its historical recommendations should not be copied as though all were current requirements in every country.
| Reference | What to check | How to avoid overinterpretation |
|---|---|---|
| ISO 80601-2-61:2026, third edition | Basic safety and essential performance of pulse oximeter equipment, including monitor, probe and extension | Consult full requirements and the edition applicable to the device and jurisdiction |
| FDA final 2013 guidance | Evidence types and system configurations | Distinguish premarket evaluation from service routines |
| Current FDA pulse oximeter page | Accuracy and pigmentation concerns; January 2025 proposal | At the October 2026 check, the proposal remained labelled draft |
| Monitor, sensor and simulator manuals | Curves, accessories, conditions, features and limitations | Confirm compatibility before interpreting a difference |
The ISO catalogue confirms scope and edition; it does not provide every criterion from the full standard. None of these references turns a maintenance test into clinical validation conducted by a service provider.
Before condemning the oximeter, check the complete configuration
A bench discrepancy may relate to the monitor, sensor, cable or selected curve. Changing several items simultaneously and repeating until it “passes” destroys the ability to investigate. A useful sequence identifies the configuration, records the result and documents each controlled change permitted by the procedure.
| Item to preserve | Example information | Decision it makes reviewable |
|---|---|---|
| Monitor | Model, serial number and version | Which system was assessed |
| Sensor and cable | Model, identification and condition | Whether the assessed accessory returned to use |
| Simulator | Model, reference and selected curve | Whether the configuration was compatible |
| Points and signals | Applied parameters and observed responses | Which conditions support the conclusion |
| Criterion and method | Procedure, version and limits | Why a result was accepted or investigated |
| Intervention and retest | What changed and the subsequent result | Whether the observed effect follows the intervention |
This prevents a familiar situation: a report describes the monitor, while a different sensor returns to the department. Evidence belongs to the configuration actually tested. Accessory traceability is part of a useful service.
How does Yagi support test documentation?
Once the system and criteria are defined, Yagi, Arkmeds’ pulse oximetry simulator, provides SpO₂ and pulse-rate parameters and manufacturer-described curves. Compatibility must be confirmed for the monitor and sensor being used.
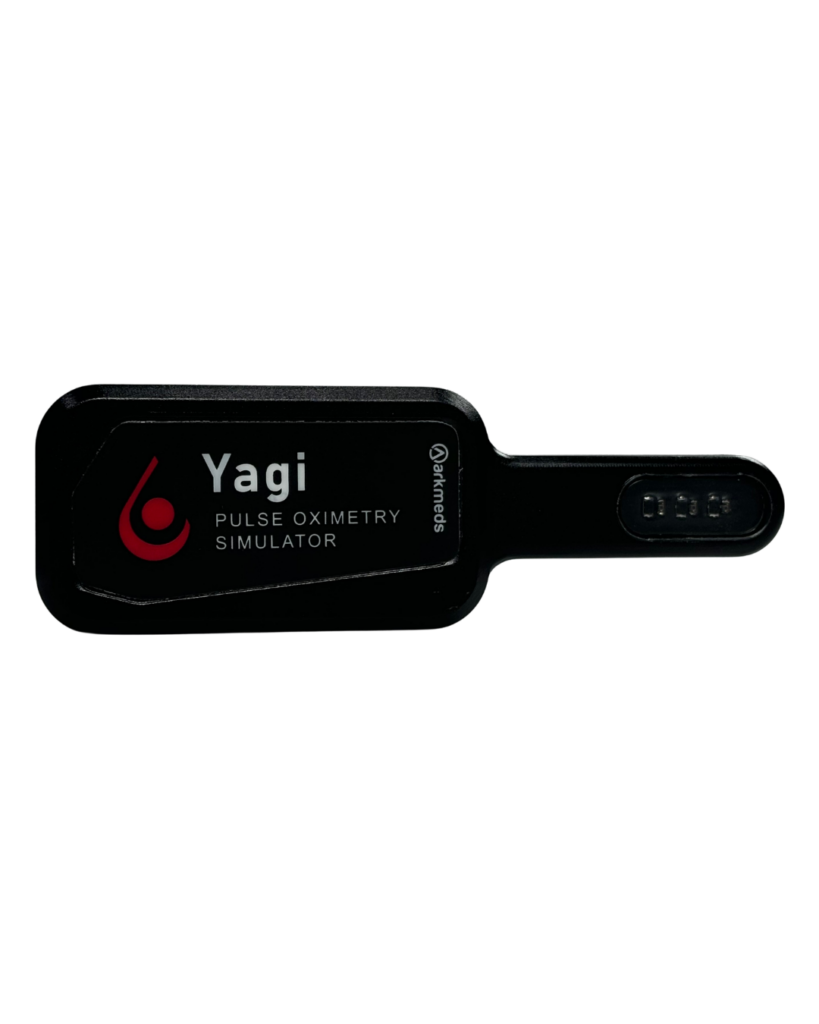
Bluetooth/Wi-Fi connectivity and Mark/Mark II app integration support the path from testing to digital reporting, with signature features described by Arkmeds. The benefit is organizing configuration, results and delivery to the customer. This does not correct measurement bias in patients or automatically grant laboratory accreditation.
Document pulse oximetry tests with Yagi
Review parameters, curves, connectivity and reporting features. Confirm the compatible configuration for your system.
Explore Yagi — page in PortugueseA report conclusion that respects the evidence
In an editorial example, compare these formulations:
| Formulation | Problem or contribution |
|---|---|
| “Pulse oximeter accuracy guaranteed in every patient” | Makes a clinical promise the test did not demonstrate |
| “Monitor X, sensor Y and cable Z assessed at the described points and curve; responses compared with the identified procedure’s criteria” | Defines configuration, parameters and basis of assessment |
Add the actual service results and judgment. Do not use the example to approve a device without measurement. The structure helps the customer understand precisely what was verified and maintain the connection between accessories and report.
Additional questions
Does changing the sensor automatically invalidate the entire history?
The previous history still describes the old configuration. The need for new tests depends on the change, manufacturer and applicable procedure. The essential point is not presenting evidence from the previous system as though it were produced with the new one.
Should clinical engineering reproduce a human desaturation study?
That is not a routine extension of maintenance. Human studies require their own scientific design, ethics and controls. Technical service should consult relevant clinical evidence and perform the tests authorized for the equipment.
Does an unexpected patient reading confirm a defect?
Not by itself. The FDA advises considering limitations and context alongside the reading. Clinical assessment belongs to the care team; technical investigation can examine integrity, accessories, functionality and history. No table in this article should be used as a SpO₂ correction or an individual clinical decision rule.
Sources and further reading
- Martin et al. (2026), BMJ — EXAKT: skin tone and fingertip pulse oximeter accuracy
- Sjoding et al. (2020) — Racial Bias in Pulse Oximetry Measurement
- FDA — Pulse Oximeters
- FDA (2013) — Pulse Oximeters, Premarket Notification Submissions [510(k)s]
- ISO 80601-2-61:2026 — Pulse oximeter equipment
- Arkmeds — Yagi pulse oximetry simulator
Source review: 13 October 2026. Published results, descriptive calculations and synthetic examples are identified separately. Graph: published Sjoding proportions and 95% confidence intervals; no recalculated intervals. These are not Arkmeds customer results.